
Instrumenting Rails with OpenTelemetry
Since I began my career in software, application instrumentation is one thing that has stayed a top priority over almost every project I have worked on. Having good, comprehensive data on how applications are running, clear indicators of when and things are breaking and a centralised place to store this data makes the lives of engineers and businesses significantly easier. If anyone is brand new to why Observability is important, I highly recommend Liz Fong-Jones’ talk on Cultivating Production Excellence.
Traditionally vendors have provided plugins for various languages, which makes getting up and running really simple, but comes with the downside of being tied into a specific vendor. In the age of decentralisation, there’s now a lot of value in data ownership and being able to take that data to other platforms.
OpenTelemetry is a project that aims to standardise instrumentation across languages and vendors by defining an open standard for how we observe our applications. The project provides SDK’s for numerous languages, but in this post I’ll be focusing on the Ruby SDK, it’s benefits and it’s pitfalls at the time of writing.
One pitfall that claims a lot of projects like this, is vendor adoption, but I’ve been very impressed so far with not only vendor support, but also how these vendors are contributing back to OpenTelemetry. Honeycomb, Google, Newrelic, Github and Shopify are all active in developing the Ruby SDK and there’s now a growing list of observability vendors who support ingestion of OpenTelemetry data.
What do OpenTelemetry Signals look like?
OpenTelemetry emits three types of signals and works to tie them together to make diving into and linking each type easy. In order of importance, we have:
- Traces
- Metrics
- Logs
Traces show us a journey through an application for a particular request and give a really clear picture of all the components and dependencies that work together to deliver a result. In Rails, this might show the incoming request, any database calls and then the response being rendered, all in a lovely time series visual. All these individual pieces that make up a trace are called Spans.
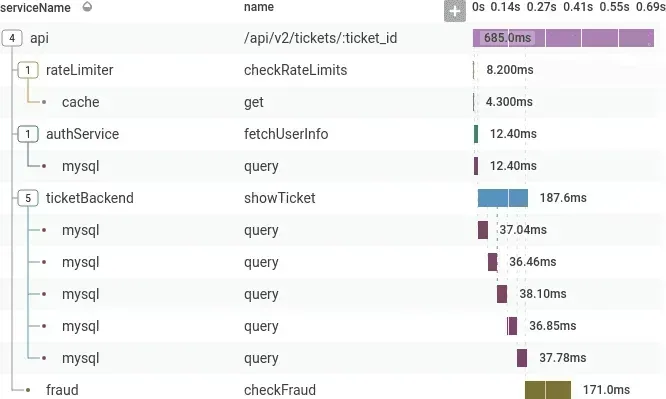
An example of spans contained within a Trace in Honeycomb https://docs.honeycomb.io/investigate/analyze/explore-traces/ Metrics allow us to capture point in time measurements, for analysis later on. These can be as simple as counters, right up to things like histogram data, for tracking values over time. Examples here in a Rails context might be the number of times we return a non 200 status code, or the size of a Sidekiq queue at any given time.
Exploring metrics in Honeycomb. Here, the graph is working on the metric memory.utilisation https://www.honeycomb.io/blog/how-metrics-behave-honeycomb Logs are probably what you’d expect, raw application logs that we might output to Standard Out or to something like Cloudwatch. By emitting these logs via the OpenTelemetry SDK, they can be linked to spans and metrics so that they can be viewed in context, making diving into issues easier than ever. OpenTelemetry specifies a structure for how logs should be formatted.
Getting Started with Ruby
In the Ruby SDK, we’re pretty luck to have quite a lot of auto-instrumentation available to us, from Rails to Sidekiq and a ton of libraries in between. For auto-instrumented libraries see this repo here. This makes getting started with OpenTelemetry as simple as plug and play! Let’s have a look at how we can get up and running in a Rails app.
First off, lets add the SDK and Auto Instrumentation to our Gemfile.
gem 'opentelemetry-sdk'gem 'opentelemetry-exporter-otlp'gem 'opentelemetry-auto-instrumentation'gem 'opentelemetry-instrumentation-rails'Next, let’s create an initializer to enable us to setup OpenTelemetry when the application boots.
require 'opentelemetry/sdk'require 'opentelemetry/exporter/otlp'require 'opentelemetry/instrumentation/all'
OpenTelemetry::SDK.configure do |c|  c.service_name = 'my-rails-app'  c.use_all()end
Firsty, we give our configuration a service name, so we can see where a Signal has come from. I’ll deep dive on naming and resources in Part 2 of this series, to show how we can really narrow down where Signals are coming from. Next, we call the use_all method which tells OpenTelemetry we’d like to use all libraries available in the auto instrumentation package. This uses introspection to determine whether or not to initialize a certain instrumentation, like Rails. In our Rails app, this will emit spans for everything from the initial request, through any database calls (with the query) and show how long it took to render the response. Not bad for out of the box!
Adding Custom Context
Now we have auto instrumentation, let’s add some custom context to our traces, that we might want to inspect in a monitoring service. In this example, let’s go with a customer ID, so we can easily track down traces related to that specific customer in the event they report an issue.
class ApplicationController < ActionController::Base  before_action :set_current_user_id
  private
  def set_current_user_id    span = OpenTelemetry::Trace.current_span    span.set_attribute('enduser.id', current_user.id)  endend
Here we do two things. Firstly we grab the current span from OpenTelemetry, then we add a new attribute to it to hold the current users ID. As OpenTelemetry is a standard, there are a list of attributes that should be used to capture information in a standard way. These are called Semantic Conventions. See here for documentation around capturing user data. This would then allow is to query for traces by the specific user, in our chosen monitoring system.
Wrapping Up
In this post, we’ve covered some basic concepts of OpenTelemetry, how to get started with the Ruby SDK, auto-instrumentation and finally adding some custom attributes to our telemetry. In Part 2, we’ll look at adding some more information about where telemetry has come from and how to export this telemetry to a monitoring system, specifically Honeycomb. See you in Part 2!